Candlestick charts are not only a staple of financial analysis but also a method of market assessment that dates back centuries, originating in Japan. These charts are highly valued for their ability to provide a detailed and visual representation of price action in almost any market, making them an essential tool for traders and investors looking to gauge market sentiment and make informed decisions.
Historical Origins #
The history of candlestick charts can be traced back to 17th-century Japan, where they were initially used by rice traders to track market prices. Munehisa Homma, a legendary rice trader from Sakata, is often credited with the development of the candlestick technique. Homma realized that while there was a link between price and the supply and demand of rice, the emotions of traders influenced the market as well. This discovery led to the development of a method that not only included the basics of price movements but also the psychological aspects of trading.
Structure of a Candlestick #
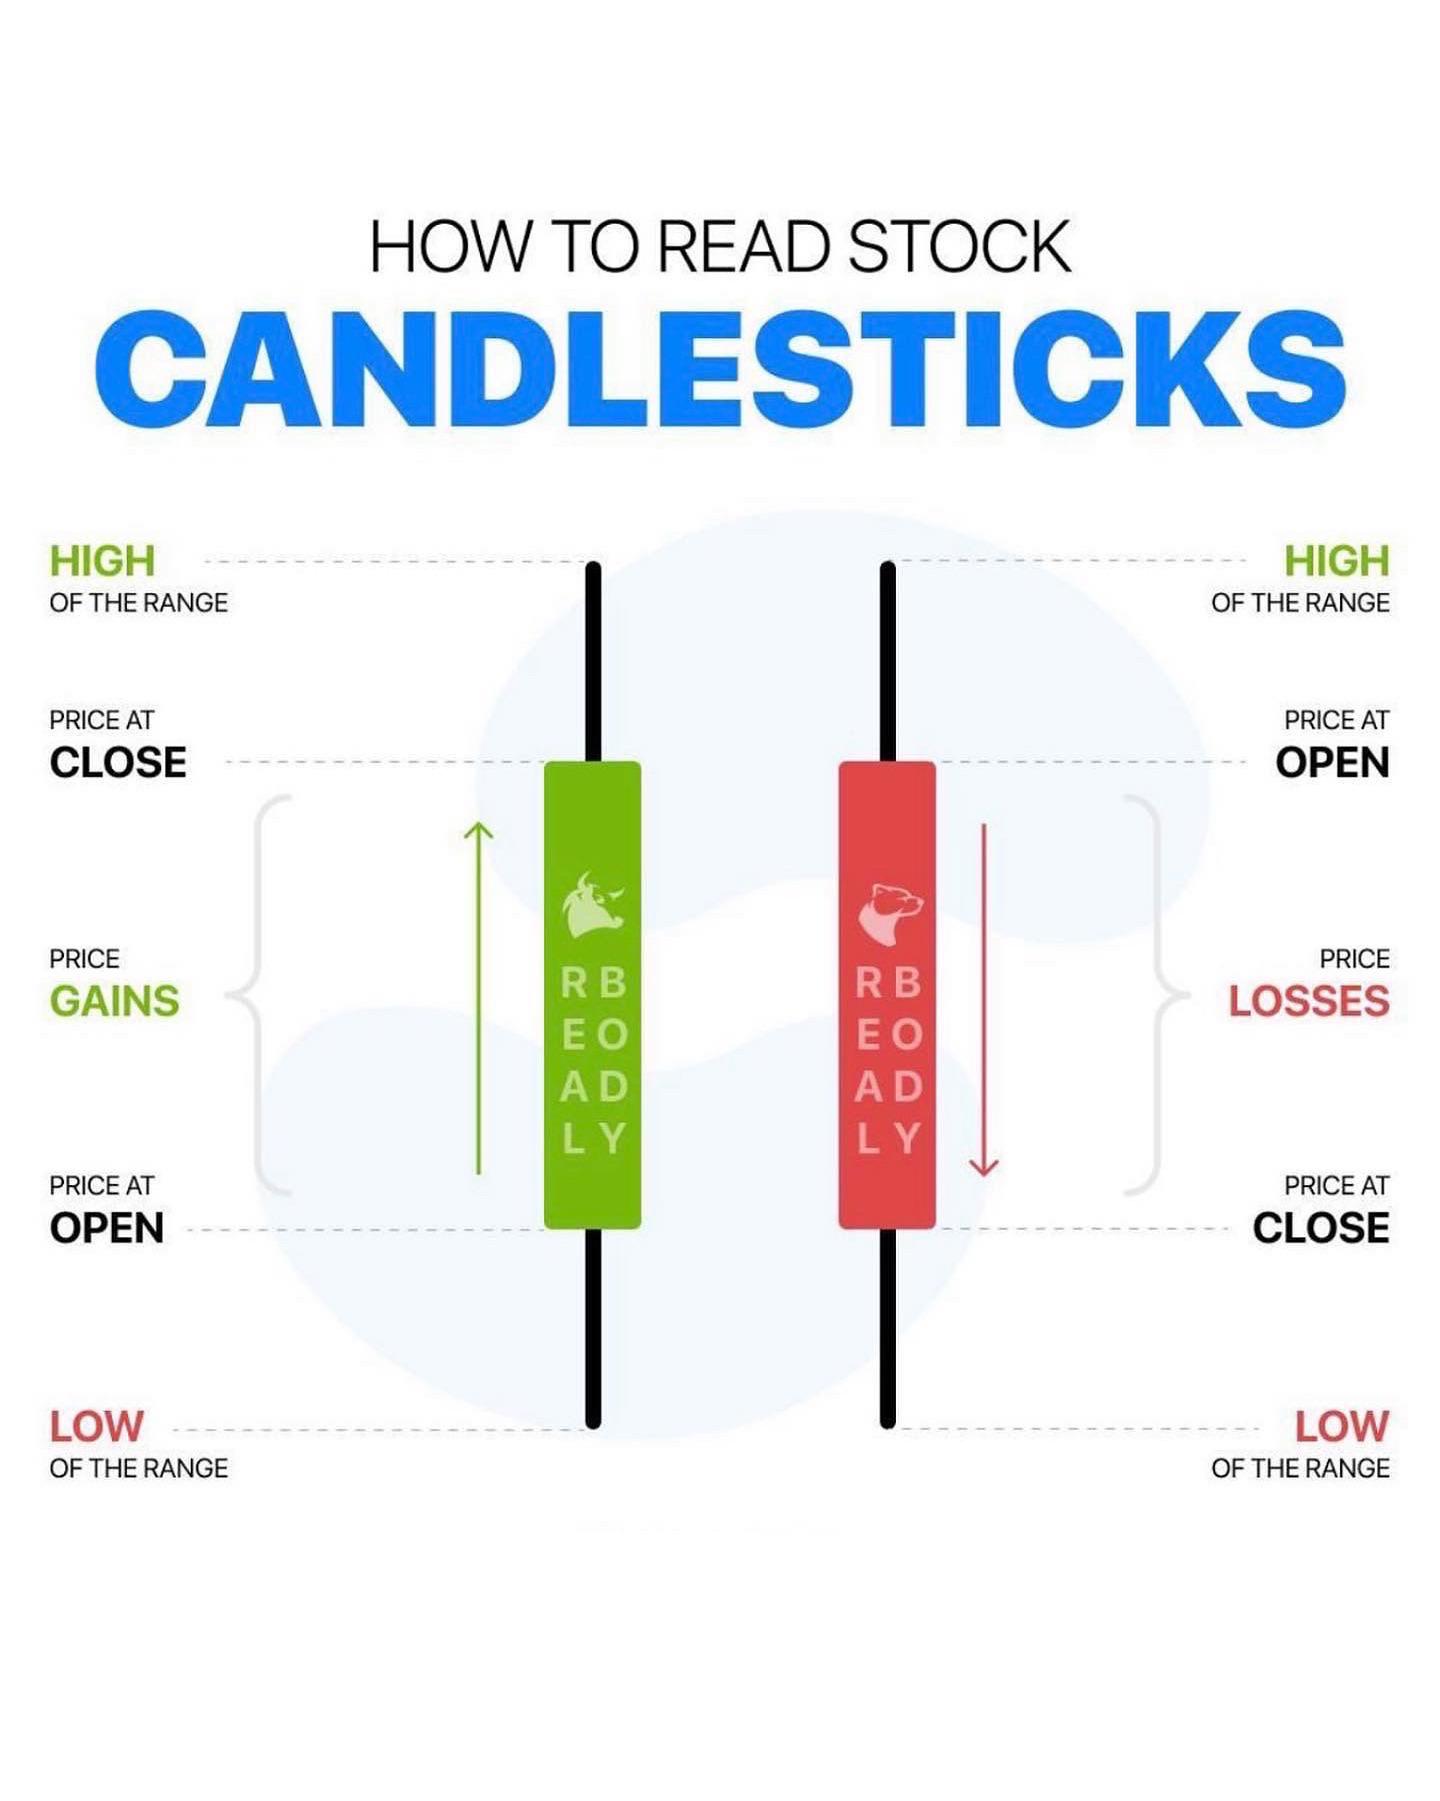
A candlestick chart provides four key pieces of information for a given time period: the opening price, the closing price, the highest price, and the lowest price. Each candlestick on the chart represents this data, which can be configured for different time periods such as a minute, an hour, a day, or even longer.
-
The Body: The main part of the candlestick is called the body (also known as the "real body"). It represents the range between the opening and closing prices. If the close is higher than the open, the candlestick is usually hollow or white, indicating buying pressure. Conversely, if the close is below the open, the candlestick is filled or black, indicating selling pressure.
-
The Shadows: Candlesticks also feature upper and lower shadows (or wicks), which protrude from the body and represent the high and low prices during the period. Long shadows indicate that trading action occurred well beyond the opening and closing prices.
Types of Candlesticks #
The appearance of candlesticks can vary dramatically, and each shape provides insights into market sentiment:
-
Long White/Green Candlesticks: These indicate strong buying pressure, with the close being significantly higher than the open.
-
Long Black/Red Candlesticks: These suggest strong selling pressure, with the close being much lower than the open.
-
Doji: This occurs when the open and close are virtually the same. A Doji represents indecision in the market and can be a signal of potential reversal, depending on previous candles.
-
Spinning Tops: These have small bodies with long upper and lower shadows and also indicate indecision or a balance between buyers and sellers.
Candlestick Patterns #
Traders pay close attention to patterns that emerge over several candlesticks:
-
Bullish Engulfing: A pattern that occurs at the end of a downtrend; a small black/red candlestick is followed by a large white/green candlestick that completely engulfs the previous candle. This indicates a potential reversal to the upside.
-
Bearish Engulfing: The opposite of bullish engulfing, this pattern appears during an uptrend and signals a potential reversal to the downside.
-
Hammer and Hanging Man: These patterns are identified by small bodies with a long lower shadow and little to no upper shadow, indicating potential reversal or continuation.
-
Morning Star and Evening Star: These are three-candlestick patterns that signal changes in market direction.
Advantages of Candlestick Charting #
Candlestick charts offer several advantages over traditional bar charts:
-
Visual Appeal: Candlesticks are easy to interpret and allow traders to quickly grasp market dynamics through visual patterns.
-
Comprehensive Information: They provide more information than a simple line chart, illustrating the intensity of trading pressure during the period.
-
Psychological Insights: Candlesticks help reveal the psychological state of the market, offering clues about potential future movements.
Candlestick charting is an indispensable tool in the arsenal of financial traders. By effectively interpreting the patterns and formations in candlestick charts, traders can anticipate possible price movements and make better trading decisions. Whether you are trading stocks, forex, or commodities, a mastery of candlestick analysis can enhance your analytical skills, giving you an edge in the competitive world of trading.
Many online resources can help you delve deeper into the world of candlesticks. Here are a few to get you started:
-
Investopedia: A great starting point for understanding candlestick basics and common patterns.
-
StockCharts: Offers educational resources and interactive charts to practice candlestick analysis.
-
Khan Academy: Provides a free video tutorial on candlestick charts, making it a good option for visual learners.